Digital lenders in Africa decide in seconds whether to give someone a loan, usually with nothing more than a phone number and a short repayment history. Get it wrong one way and the lender loses money. Get it wrong the other way and a person who would have repaid is turned away, often someone the formal banking system already ignores.
For our second project in Machine Learning Essentials at Ashesi, my group was given a fictional lender, NkwaPay, that wants to enter Ghana. It has data from Kenya. The brief: build models that predict default and recommend a loan limit, decide whether they can be trusted in Ghana, audit them for fairness and regulation, and ship them as a working product.
This article covers what we found, why the model we shipped is the simplest one we trained, and why the most important thing the system does is say "I don't know" about Ghana.
The team
| Member | Owned |
|---|---|
| Perfect Elorm Avugla | Data and features, exploratory analysis, kNN and SVM |
| Henry Kofi Brandoh | Classification, validation study, calibration, cost matrix, confidence intervals |
| Bernard Marfo Adjei | Regression models, the scoring service and app, tests, project lead |
| Eugene Sewor (me) | Random Forest and LightGBM, Kenya-to-Ghana transfer, fairness audit, Model Card, Datasheet, regulatory map |
The data, and why default is hard to predict
The training set has 68,654 loans from 6,540 Kenyan customers, from October 2021 to November 2024. Only 1.83% defaulted. Most loans are small and last seven days.
A rare target changes how you measure everything. A model that predicts "no default" for everyone is 98% accurate and completely useless. So we judged models on PR-AUC, which only rewards finding the rare defaulters, and treated 0.018 (the default rate) as the floor any model had to beat.
The default rate also moves: about 1.3% in 2022 and about 10% from 2023. A model trained on calm years and used in a rough one will underestimate risk, which shaped how we validated.
Two columns gave the answer away
Before training anything we checked how well each column separates defaulters on its own.
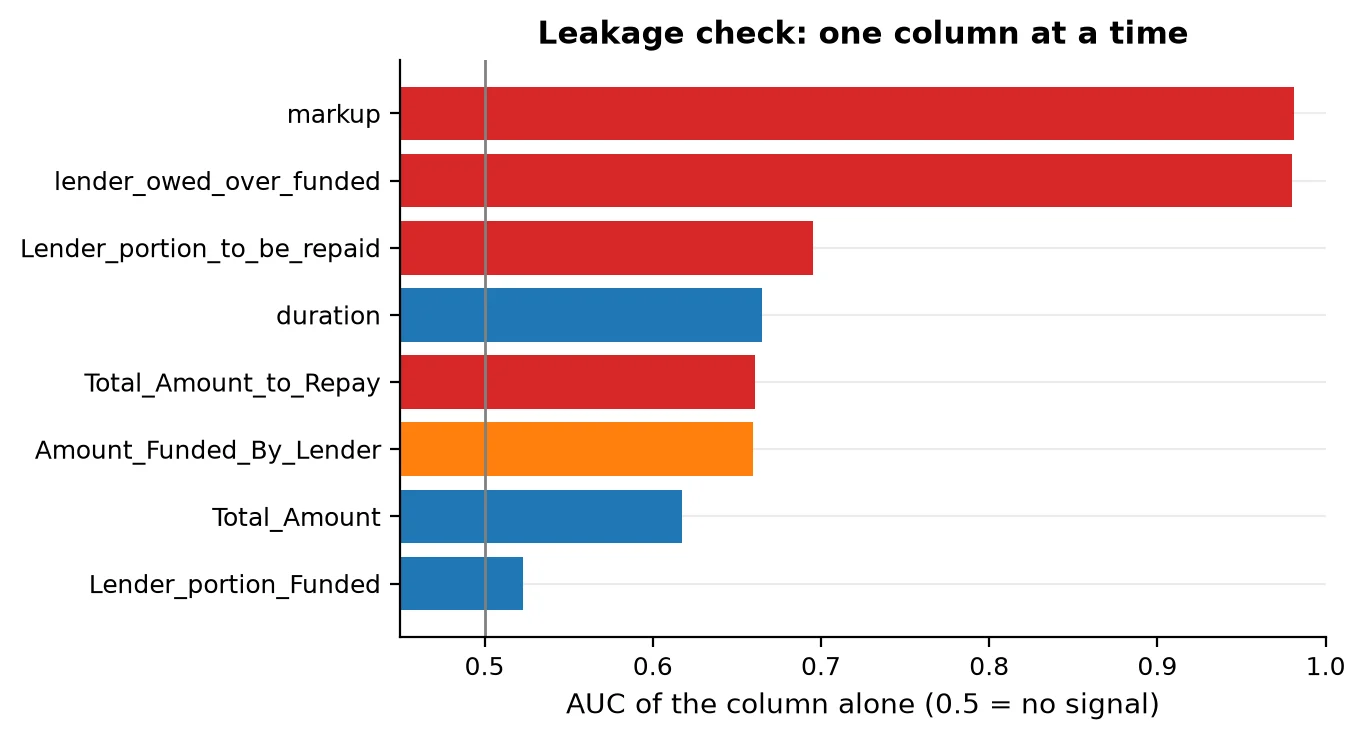
The repayment markup scored an AUC of about 0.98 by itself. That isn't a brilliant feature; it's information that only exists after the borrower has repaid or failed to. A model trained with it would look superb and be worthless on a new application. We dropped both repayment columns and built every borrower-history feature only from earlier loans whose due date had already passed, with tests that fail if a future value sneaks in.
Honest validation: random folds flatter you
We trained 16 models: 9 for default (from a majority baseline through logistic regression, kNN, an RBF SVM, trees, Random Forest, LightGBM and two PyTorch Lightning models) and 7 for the loan amount. Each one was scored three ways:
- Random folds, the default most tutorials use.
- By customer, so no borrower appears in both training and validation.
- By time, training on loans before 2023 and validating on 2023 onwards.
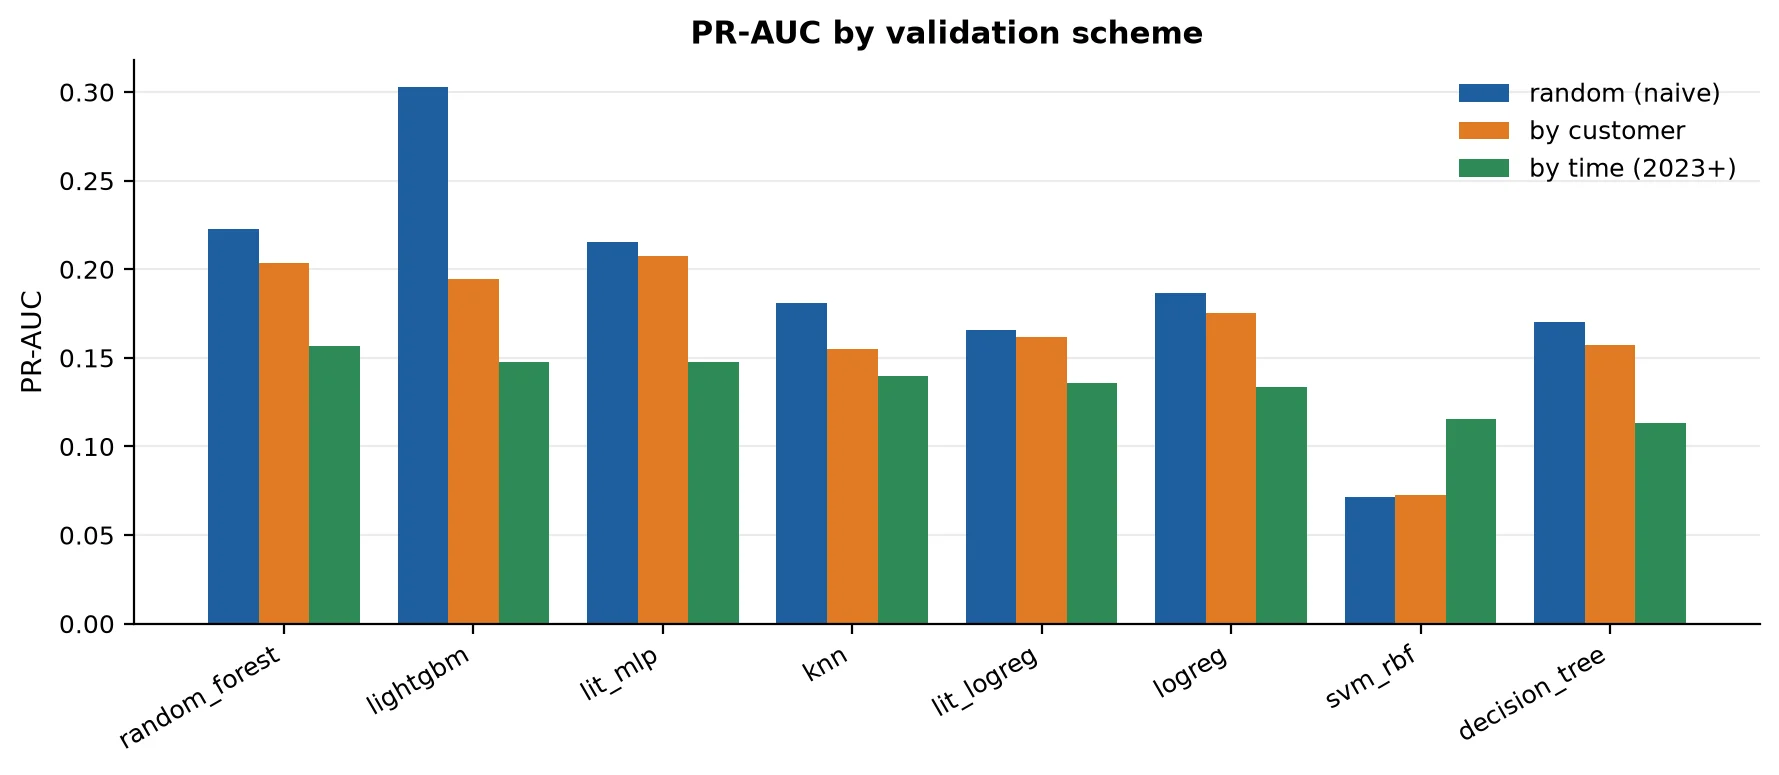
Random folds put the same customer's loans on both sides of the split, so the model partly memorises people instead of learning risk. LightGBM went from 0.30 to 0.19 to 0.15 as the test got more honest. Every model ends up around a ROC-AUC of 0.6 on the 2023+ period. That number, not the random-fold one, is closest to what a lender would actually experience.
Why we shipped logistic regression
By customer, the best rankers were the MLP (PR-AUC 0.207) and Random Forest (0.204). Logistic regression scored 0.175, with a 95% confidence interval of 0.154 to 0.199 from a customer-level bootstrap. The intervals overlap, so the "better" models aren't reliably better. On the 2023+ period, logistic regression's ROC-AUC (0.633) actually beat Random Forest (0.619) and LightGBM (0.582).
Given no real accuracy advantage, the deciding factors were practical:
- It explains itself exactly. One weight per input means each decision's top three reasons come straight from the log-odds, in about 9 ms. Getting the same from the tree models through SHAP took roughly 289 ms (Random Forest) to 417 ms (LightGBM) per call.
- The credit committee asked for it. The brief's lender wanted a model it could justify to a regulator and a borrower.
- It's calibrated as well as the forest for first-time borrowers, where it matters most.
For the loan limit, the trees clearly won: LightGBM's error was about $1,114 against $1,745 for ridge regression. So the limit comes from a LightGBM model trained to predict a high (85th-percentile) amount, used as a cap.
Probabilities you can act on
A class-weighted model's scores are not probabilities. Ours averaged 0.32 when the real default rate was 0.018, so any threshold read off them is meaningless.
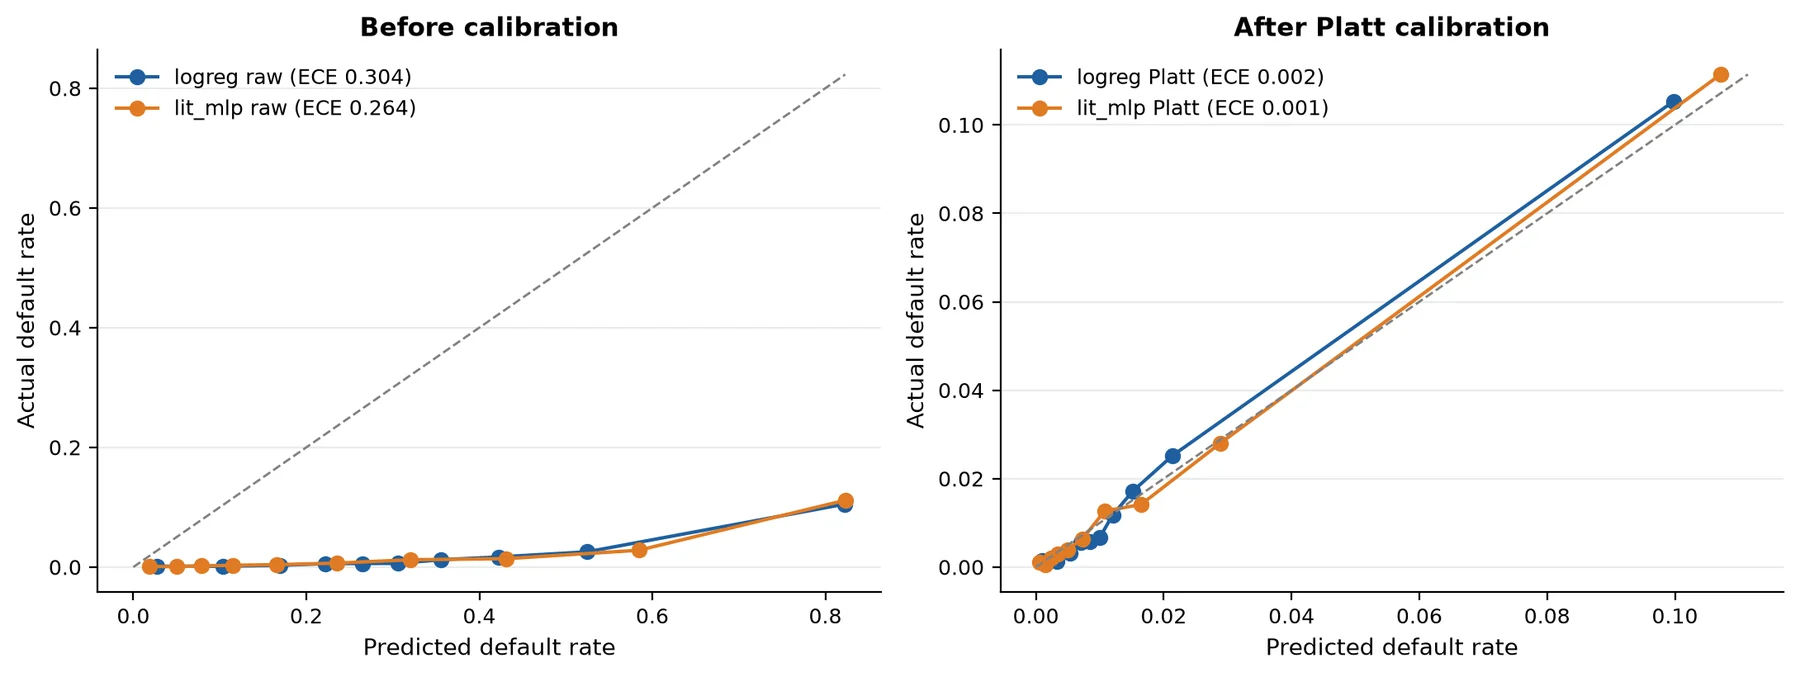
Platt scaling, fitted on out-of-fold scores, brought the calibration error down from 0.304 to 0.002. Once a score of 0.10 really means "about a 10% chance", you can set the decline threshold from money instead of guesswork.
We built the cost matrix in cedis from Ghana's own loans: a median loan of about GHS 3,000, a 3% fee, collection costs, a 20% recovery rate, and the assumption that a wrongly declined good borrower costs the lender three future loans. That gives a decline threshold of 0.10.
The fairness audit
This was my part of the project, and it's where the numbers got uncomfortable.
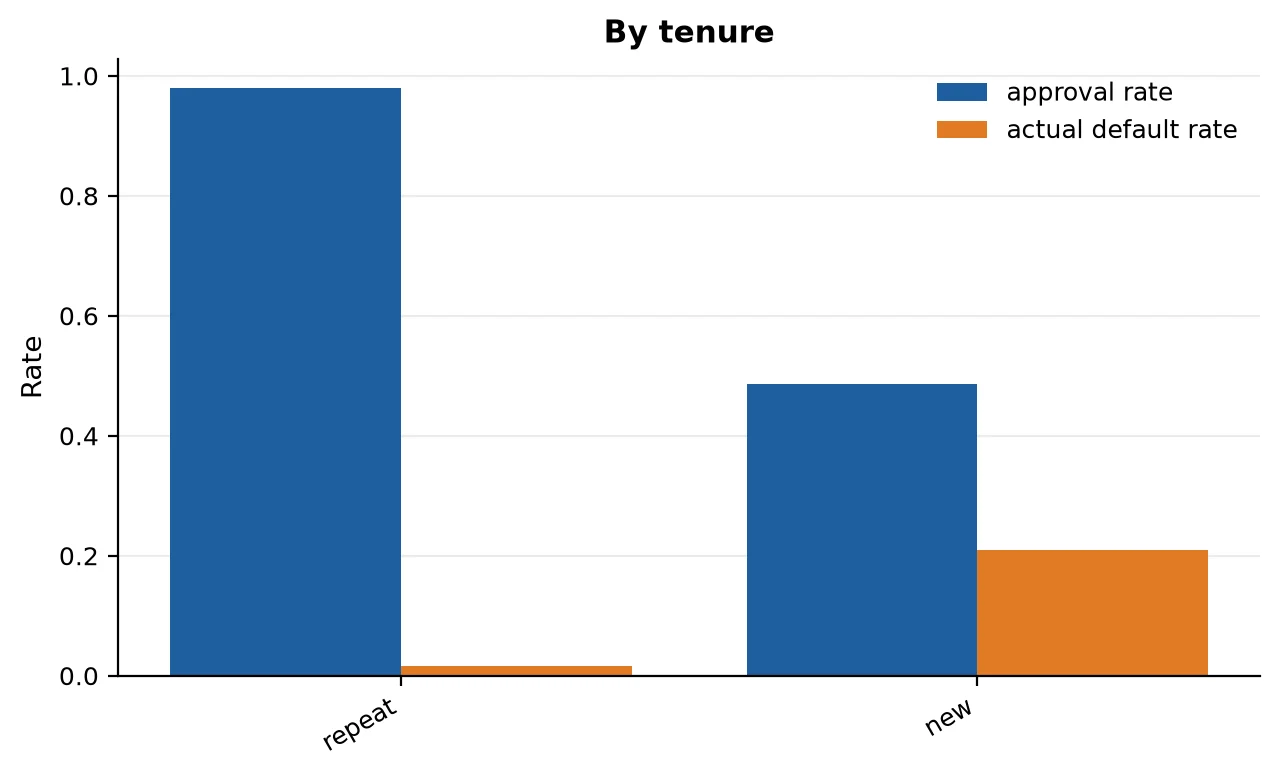
At the 0.10 threshold, 48.7% of first-time borrowers are approved, against 97.9% of repeat borrowers: a disparate-impact ratio of 0.50, well below the usual 0.8 warning line. Their risk really is higher (21% default against 1.7%), so the model isn't wrong. But Global Findex data for Ghana suggests that people with no credit history are disproportionately women, rural adults and poorer households, the same groups Ghana's digital-credit rules aim to bring in.
The gap is a cost assumption, not a model property
The same model gives very different first-time approval rates depending on the cost matrix behind the threshold:
| Cost matrix | Threshold | First-time approval |
|---|---|---|
| Kenyan shillings, 1 lost loan | 0.019 | 0% |
| Cedis, 1 lost loan | 0.036 | 12% |
| Cedis, 3 lost loans (shipped) | 0.10 | 49% |
| Cedis, 6 lost loans | 0.18 | 70% |
Fairness here is mostly a business decision dressed up as a technical one. The audit's job is to make that visible, not to hide it inside a threshold.
Why removing the "first-time" flag doesn't help
The obvious fix is to stop telling the model who is new. It doesn't work: the borrower-history fields identify first-time borrowers with a proxy strength of 0.91. Lender and product identify Ghana perfectly. Dropping a column just moves the same signal somewhere less visible.
A mitigation that acts on the decision
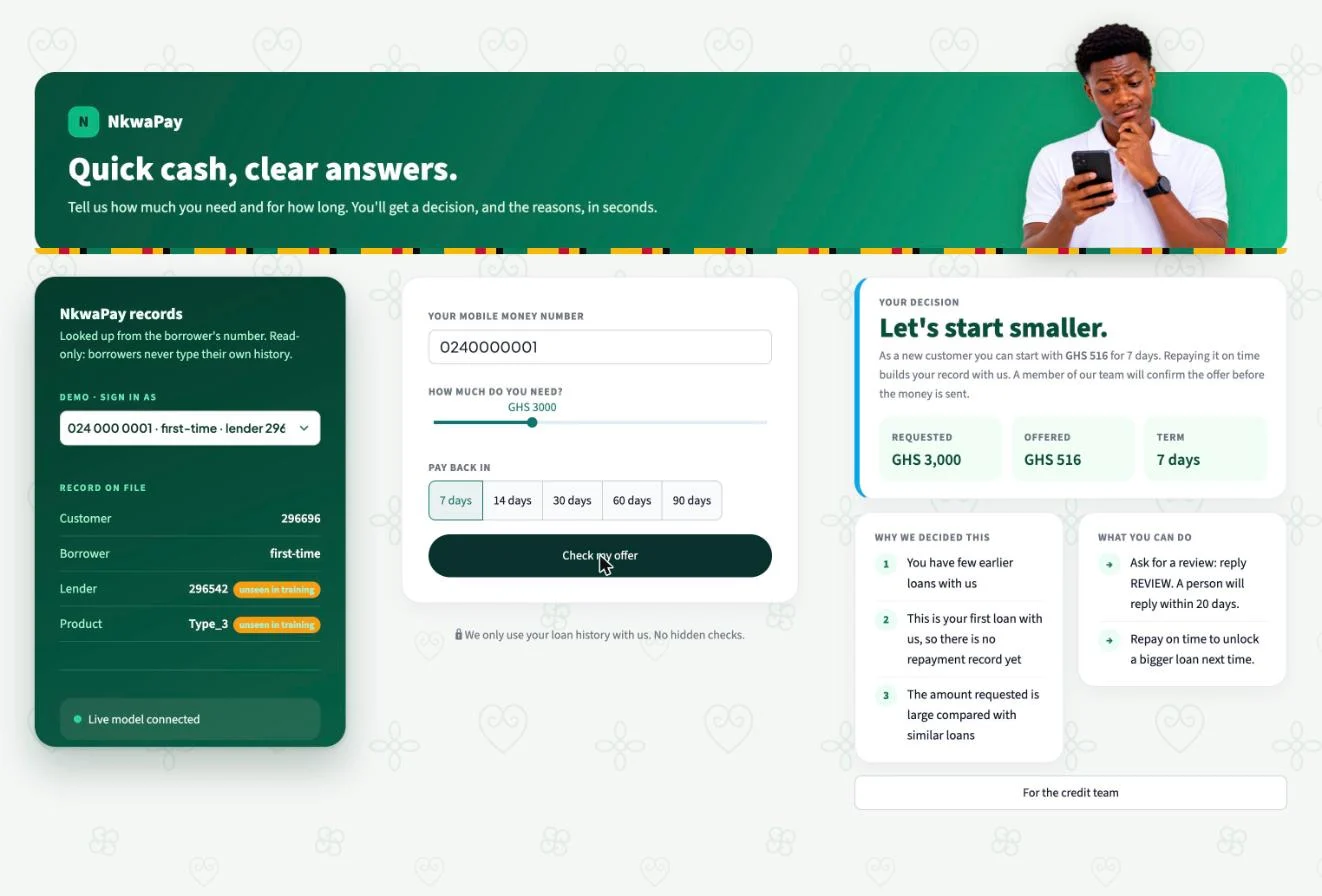
So the fix went into the decision rule instead. A first-time borrower whose calibrated risk is between 0.10 and 0.30 now gets a starter loan of 25% of the request instead of a decline. A smaller loan caps the loss on a riskier group while letting good borrowers build a record.
- First-time approval rises from 49% to 81% (ratio 0.83, above 0.8).
- 185 people get a starter loan, and 18% of them default.
- The extra expected cost is about GHS 18 per first-time applicant, against GHS 38.7k in total if the same band were approved at full size.
That's the "Let's start smaller" screen in the app.
Does a Kenyan model work in Ghana?
Short answer: we can't know yet, and the system says so.
Ghana's applications are in the test set only, with no repayment outcomes. So the question becomes how different the two markets look. A domain classifier, trained to tell a Kenyan application from a Ghanaian one, does it almost perfectly.
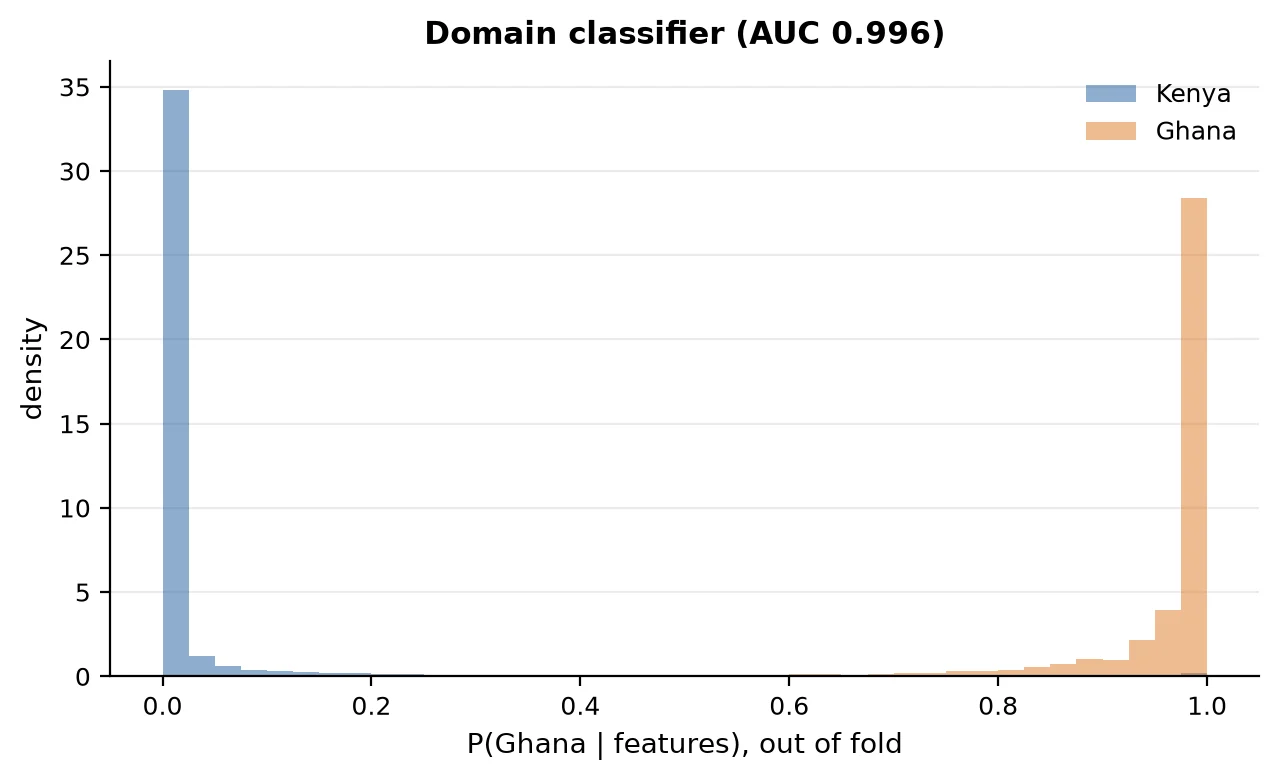
Ghanaian loans are about 10 times larger, 97% come from lenders the model never saw, and nobody has a labelled repayment history. When the classifier can tell the markets apart this easily, Kenyan accuracy says very little about Ghanaian accuracy. Reweighting the Kenyan data to look like Ghana left an effective sample of about 4%, too small to trust, so we didn't report it.
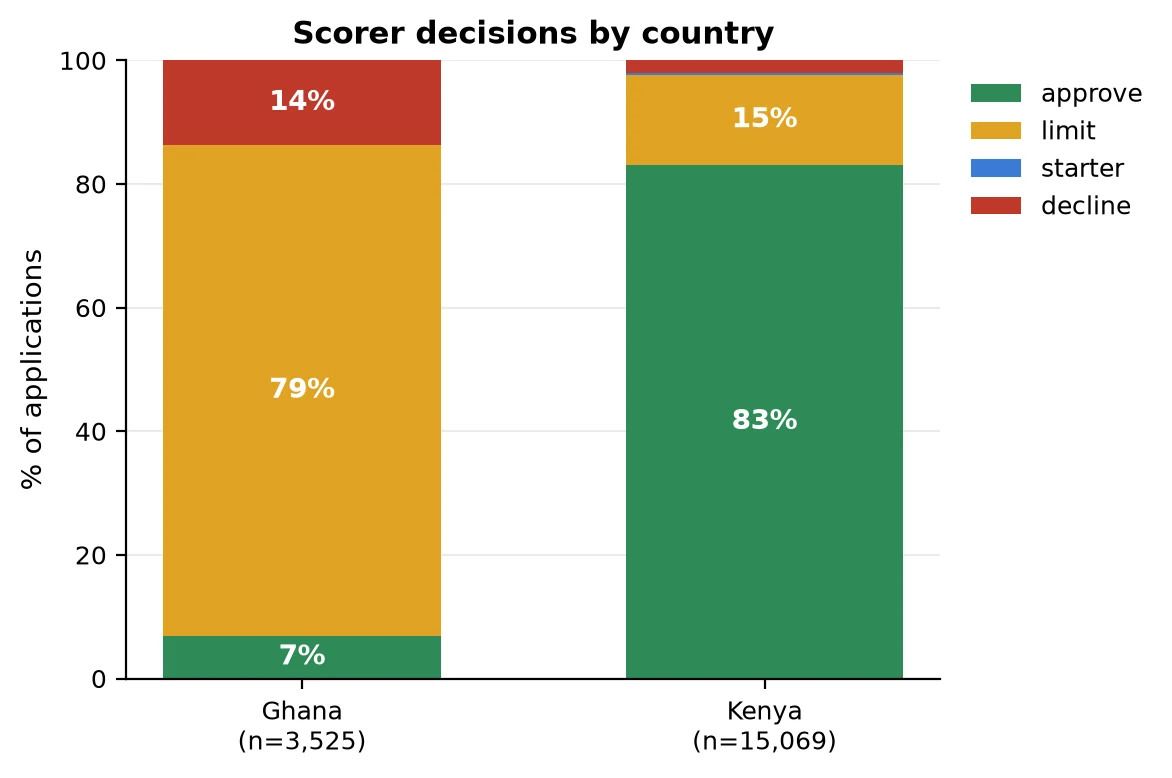
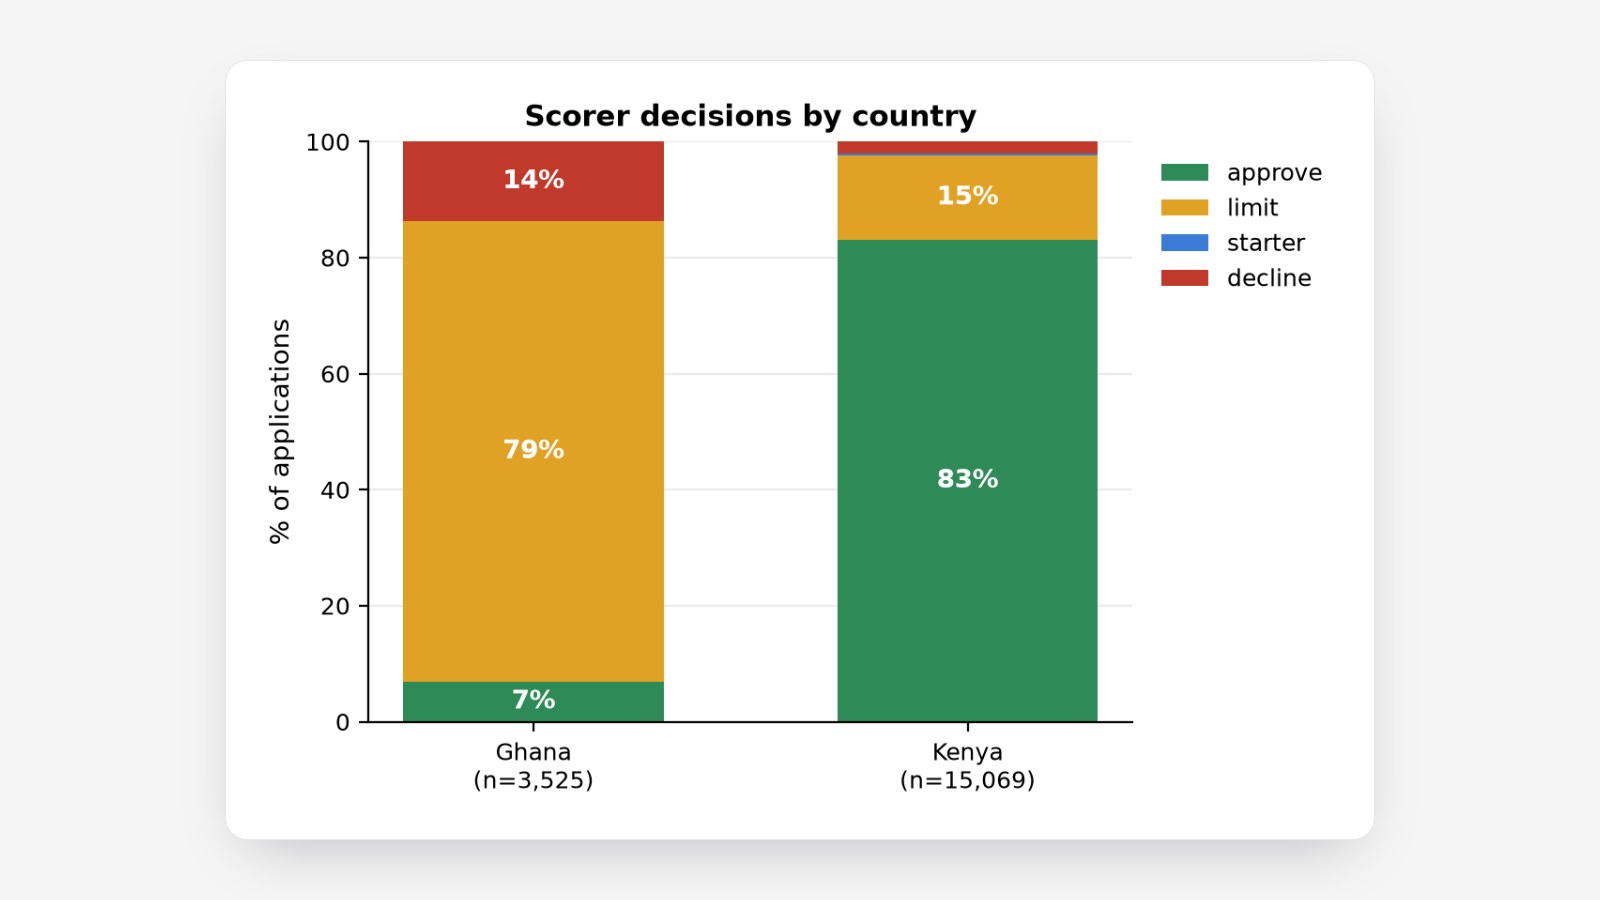
Run through the scorer, only 7% of Ghanaian applications are approved in full: 79% are limited to a median 46% of the request and 14% are declined. Every Ghanaian score carries a review flag. Our recommendation was explicit: no automated lending in Ghana until a capped pilot of about 3,500 loans over roughly three months, followed by recalibration on Ghanaian outcomes.
Shipping it
The scorer is a small Python service. For each application it returns a calibrated probability, a decision (approve, limit, starter or decline), a recommended limit in local currency, three reasons, and review flags. Over 1,000 calls its median latency was about 45 ms.
The borrower sees reasons in plain language, worded so they can act on them. A reason based on the funding lender, which borrowers don't choose, is reworded. Every decision offers a way to ask a person to review it.
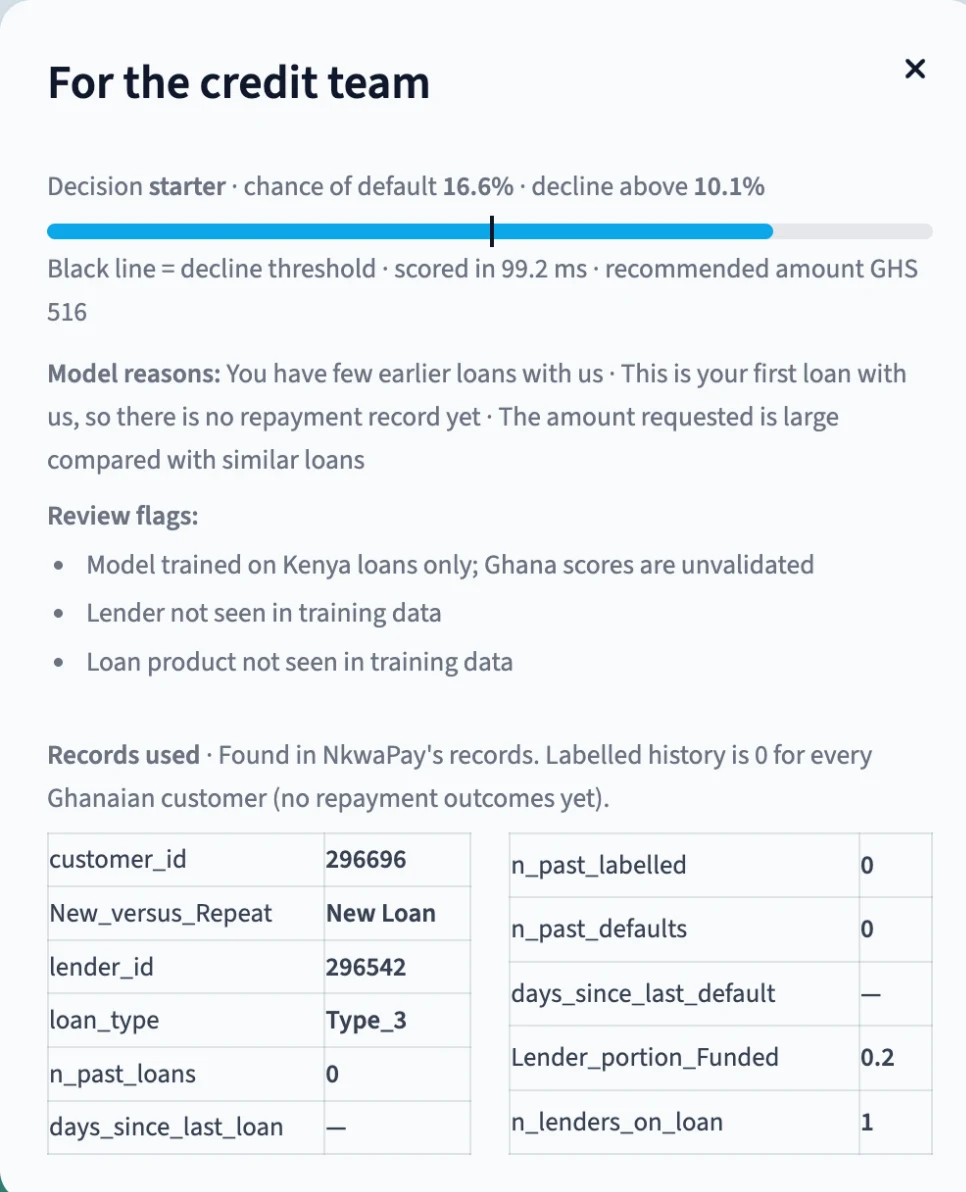
The credit team gets the full picture: the probability against the threshold, the reasons, and flags such as "Model trained on Kenya loans only; Ghana scores are unvalidated" and "Lender not seen in training data". Borrowers never type their own history; it's looked up from their number.
What isn't done
The audit maps the system against Ghana's digital-credit directive, the Data Protection Act and the Credit Reporting Act. Several requirements aren't met yet:
- a hard cap at the regulator's loan limit;
- pre-agreement and total-cost disclosure;
- decision logging for supervisors;
- a data protection impact assessment, consent capture and registration;
- credit-bureau reporting;
- a real review process with a 20-day response.
The first three, plus review logging, are code changes we can make. The rest are lender processes. The cost assumptions behind the threshold, especially the three lost loans, also need replacing with pilot figures.
What I took away
- The honest validation number is the one that matters. Random folds made our best model look twice as good as it is on future loans.
- Calibrate before you set a threshold. Without it, the threshold is a number with no meaning.
- Simple wins when the accuracy gap isn't real. A model you can explain in 9 ms beat a slightly higher PR-AUC with overlapping intervals.
- Fairness lives in the decision rule as much as the model. Proxies made "remove the sensitive column" useless; changing what the system does with a borderline score made a measurable difference at a known cost.
- A good system knows the edge of its knowledge. The most valuable output for Ghana isn't a score; it's the flag that says the score hasn't been earned yet.
The code, notebooks, Model Card, Datasheet and full audit are on GitHub, and the app is live at loan.mesorablocks.online.